By James Rich, Managing Partner & Co-Founder
As the costs of raw materials, energy, electricity, and water surge, scalable products and services that enhance resource efficiency are becoming high-growth investment opportunities.
Executive Summary
Demand for raw materials has more than tripled over the last 50 years and continues to grow by an average of 2.3% per year[i]. As the costs of these and other resources, such as energy, electricity and water, continue to rise, companies and governments are under growing pressure to use these inputs more efficiently.
This shift is reversing decades of declining real prices and is being accelerated by regulatory mandates and climate goals. In parallel, a wave of enabling products and services, from IoT sensors and AI analytics to advanced recycling and pyrolysis systems, is making resource efficiency a reality and more scalable and cost-effective than ever.
For investors, this convergence of economic, environmental, and technological forces is creating a diverse set of attractive investment opportunities. According to the International Energy Agency (IEA) and the Ellen MacArthur Foundation, the circular economy, resource efficiency and electrification markets may grow to $3.4 trillion annually by 2030[ii]. Markets like recycling and composting, waste-to-energy, smart water management, and biochar are expanding rapidly. These sectors not only offer strong financial upside but also align with the long-term push towards climate resilience, circularity, and modernization.
Private credit is also increasingly recognized as a tool for financing companies that enhance resource efficiency. Whereas equity investors struggle to fund capital-intensive solutions, private credit offers flexibility and speed to fill the gap. By providing tailored financing structures, private credit investors can access growth in efficiency plays that are critical to cost reduction and improved performance, while capturing attractive risk-adjusted returns in underserved markets.
Rising Cost of Resources
Many of the world’s key resources, including metals, minerals, energy, and electricity, have seen significant cost increases in recent decades, reversing a long trend of declining real prices throughout the 20th-century. Even water, traditionally government-subsidized, has begun to show rising costs.
Raw Materials
Throughout the 20th century, real prices for many raw materials declined, largely due to advances in mining and agricultural productivity. However, around the year 2000, this trend reversed. Since then, global raw material costs have been on the rise. Industrial metals such as copper, aluminum, and steel as well as critical minerals like lithium and nickel, have become significantly more expensive in the 21st century.
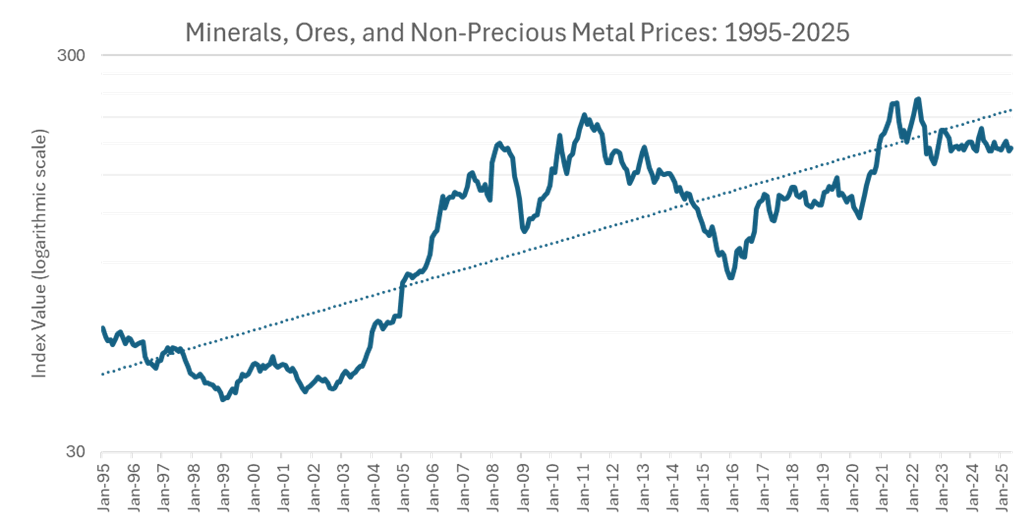
The surge in materials prices over the last 30 years is primarily driven by soaring demand for materials essential to the global energy and digital transitions. For example, lithium is crucial for batteries, copper supports electrification, and nickel and cobalt are key components in electric vehicle batteries and high-performance alloys.
Energy and Electricity
Global energy prices have experienced an upward trend over the past two decades. After collapsing during COVID-19, fossil fuel prices surged to historic highs in 2022, driven by post-pandemic demand and the Russia-Ukraine war. Although prices have moderated since, the IMF’s global energy price index in 2025 is still 66% higher than its 2016 baseline[iii]. Over the long term, energy costs continue to rise due to both demand growth—especially from emerging markets—and the increasing expense of extracting and delivering new supply from complex sources like deepwater fields and LNG infrastructure.
Electricity prices have also been steadily rising. After a decade of relatively flat rates during the 2010s, U.S. consumers are now experiencing noticeable increases in their electric bills. As of 2024, retail power prices were climbing at an annual rate of 3–4%, outpacing overall inflation[iv]. The U.S. Energy Information Administration (EIA) projects this trend will continue, with American households expected to pay the highest rate on record in 2025[v].
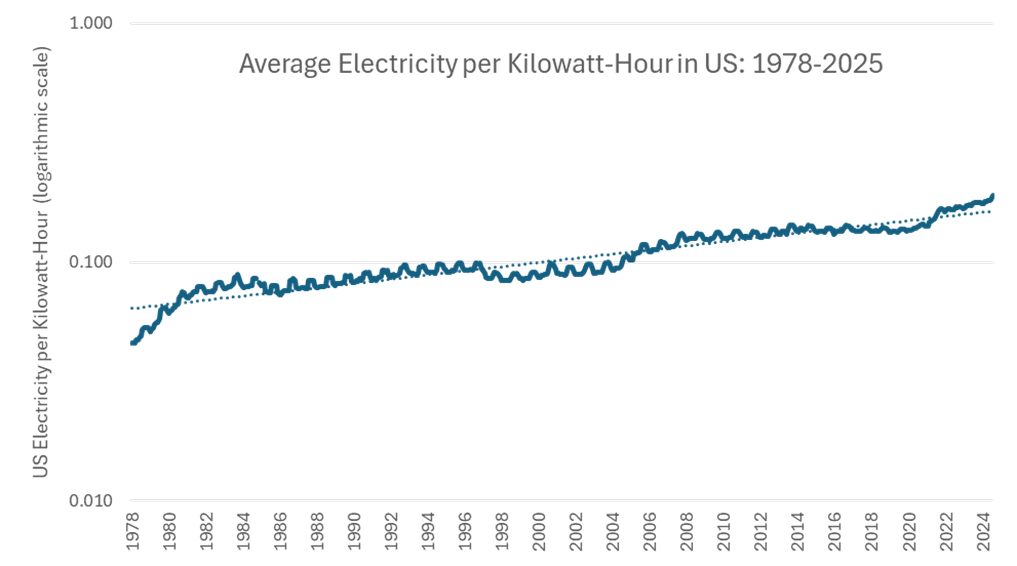
Several factors are driving electricity price increases. Energy costs are higher and utilities are investing heavily to replace aging transmission and distribution infrastructure and to connect renewable power generation sources. As a result, transmission and distribution costs now make up a growing share of electricity bills, pushing prices higher even when fuel costs remain stable[vi]. Additionally, supply disruptions from events like the 2021 Texas winter storm have added pressure. Meanwhile, the electrification of sectors such as transportation and heating is boosting demand. Without a matching increase in supply, this growing demand will continue to drive electricity prices upward.
While electricity is a major cost driver for efficiency upgrades, many resource pressures also stem from broader forms of energy use—including thermal, chemical, and combustion-based systems—making comprehensive energy efficiency essential for enhancing both resilience and operational performance.
Water
Water stands out among natural resources because it is typically delivered as a public utility, often at low, government-subsidized prices. However, even water is becoming more expensive due to a combination of overdue infrastructure investments, increasing scarcity, and rising treatment costs. According to Global Water Intelligence, 2023–2024 saw the steepest global increase in water tariffs ever recorded, with average bills for water, wastewater, and stormwater services rising by 10.7%[vii].
This surge is the result of a “perfect storm” of cost pressures. Utilities are facing higher expenses from long-delayed upgrades, expansions, and the need to build resilience against climate change. Delivering water is energy-intensive, and with energy and electricity prices climbing, operational costs have followed suit. Additionally, the prices of treatment chemicals and construction materials—such as those used for pipes—have risen sharply, echoing broader trends in raw material costs described above. Climate change is also forcing utilities to invest in adaptive infrastructure, including flood protection and drought-resilient solutions like desalination and water recycling systems.
Additional Drivers of Demand for Efficiency
Increasing Regulation
Despite the United States federal government’s loosening of climate regulations under the new administration, state and foreign governments are imposing stricter environmental rules, making resource efficiency a compliance issue. New laws on waste reduction, circular economy, emissions, and ESG disclosure are raising the bar. For example, the EU’s latest Packaging Waste Directive (effective in 2025) mandates higher recycled content and reuse, essentially forcing companies to improve material efficiency. Similarly, mandatory climate disclosure rules in many jurisdictions require firms to show progress on efficiency and emissions. National rulebooks now push efficiency “as much as balance sheet pressures”[viii], meaning companies must proactively reduce waste and emissions to stay within legal limits and avoid penalties.
Climate Targets
Companies are also pursuing ambitious environmental targets like net-zero emissions and waste reduction. Over 8,000 companies around the world have set science-based decarbonization targets[ix]. Achieving these goals requires using resources more efficiently since efficiency directly lowers carbon and waste footprints.
Investment Opportunities
A wave of products and services is providing compelling investment opportunities tied to resource efficiency. Products such as IoT-enabled leak detection, AI-powered methane sensors, smart irrigation systems, and advanced pyrolysis reactors are becoming more affordable and scalable. A non-exhaustive list of some of these solutions is shown in the table below, along with a discussion of each in the following pages.
| Category | Global Market Size & Growth | Key Drivers |
| Recycling and Composting | $600 billion[x] (5.9% CAGR[xi]) | Rising virgin material and energy costs; stricter recycling mandates; landfill bans |
| Waste-to-Energy | $63 billion by 2030[xii] (8.7% CAGR) | Growing municipal waste volumes; demand for baseload renewable energy |
| Smart Water Management | $51 billion by 2033 (12.7% CAGR)[xiii] | High water loss from aging infrastructure; affordable IoT and AI monitoring tools |
| Methane Leak Detection | $27.9 billion by 2030 (4.5% CAGR)[xiv] | Methane’s climate and economic impact; global pledges and tightening regulations |
| Smart Irrigation | $2.65 billion by 2030 (10.8% CAGR)[xv] | Water stress and rising irrigation costs; technology cost declines |
| Biochar | $1.6 billion by 2033 (14% CAGR)[xvi] | Soil health and carbon sequestration benefits; abundant low-cost biomass feedstock |
Recycling and Composting
Recycled materials like scrap metals, paper, and plastics continue to gain traction as the cost of virgin materials rises. Recycling offers major energy savings—up to 95% for aluminum and 74% for steel[xvii]—making it an increasingly attractive alternative as energy and electricity prices climb. This economic edge is driving demand for expanded recycling capacity.
As a result, industries such as packaging, automotive, and construction are turning to recycled inputs to cut operating costs. Governments around the world are also tightening recycling mandates and banning organic waste in landfills. These shifts, along with global climate pledges like the Global Methane Pledge, are fueling continued public and private investment in recycling and composting infrastructure.
The U.S. recycles only about 32% of its municipal waste[xviii], leaving a large untapped supply. Advances in sorting technology and chemical recycling are unlocking new streams, including mixed plastics and textiles. On the composting side, innovations like in-vessel composters are enabling faster, cleaner processing of food and yard waste, especially in urban areas.
Contamination from improper sorting can degrade material quality and raise processing costs. Recycling often operates on thin margins and is vulnerable to commodity price swings, like when cheap oil undercuts recycled plastics. These factors make revenue streams volatile, posing risks for investors in the recycling sector — though growing policy support, innovation in sorting technologies, and rising demand for recycled inputs are steadily improving the sector’s long-term fundamentals.
Waste-to-Energy
Waste-to-energy (WTE) refers to converting waste into usable energy—electricity, heat, or fuel—through methods like incineration with energy recovery, anaerobic digestion, and advanced thermal processes such as gasification. WTE addresses two major challenges: managing growing waste volumes and generating alternative energy.
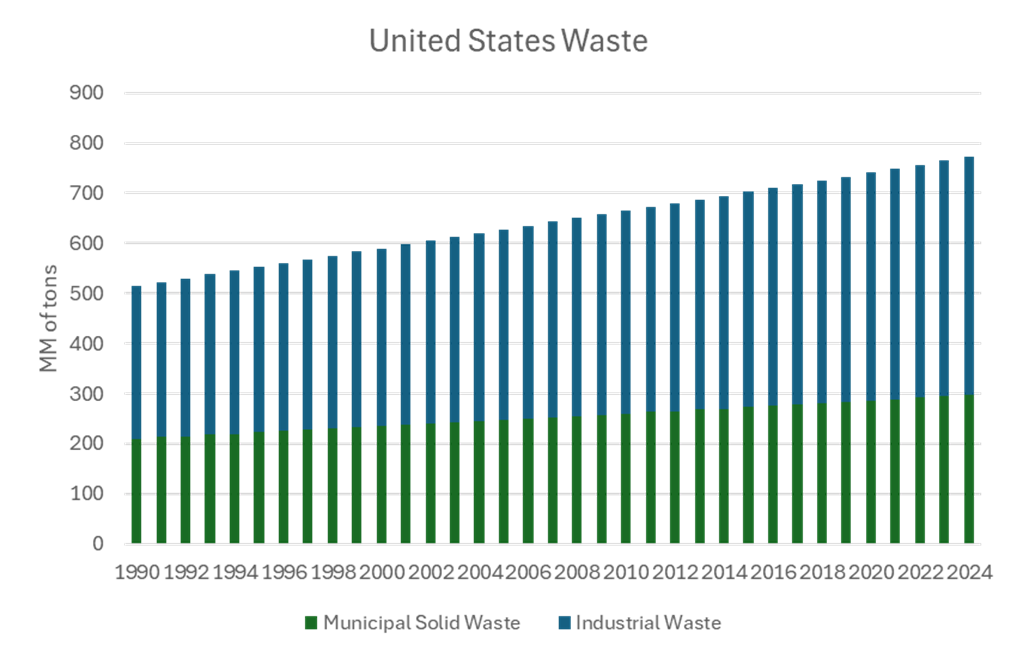
With global municipal solid waste projected to rise 70% by 2050[xix], WTE offers a scalable alternative to landfilling. Municipalities and utilities are increasingly interested in WTE for its ability to provide steady, baseload power from a reliable “fuel” source—garbage. Modern WTE plants are cleaner and more efficient, and newer technologies can even produce fuels or chemicals from waste.
The growing volume of waste, especially in urban areas, ensures a steady feedstock for WTE facilities. Municipalities benefit by reducing landfill costs while generating energy. Advances in emissions controls and energy recovery systems have improved the environmental performance of WTE, making it more viable and acceptable.
However, WTE projects are capital-intensive, often requiring hundreds of millions in upfront investment and long payback periods. Regulatory hurdles, environmental concerns, and community opposition can delay or derail projects. Profitability is sensitive to tipping fees, subsidies, and competition from cheaper disposal options, adding to financial considerations for investors — yet as waste volumes grow and clean energy demand rises, modern WTE technologies are gaining policy support and proving increasingly viable in well-structured markets.
Smart Water Management
Smart water management focuses on minimizing losses and improving the performance of water supply systems. Key strategies include leak detection, pressure management, and smart metering. Technologies like acoustic sensors, IoT-enabled meters, and flow analytics software are helping utilities detect issues earlier and manage networks more effectively.
Globally, about 30% of treated water is lost before reaching customers[xx], representing both a financial and resource loss. Utilities are under pressure to reduce this “non-revenue water,” especially in drought-prone areas like California. Aging infrastructure and rising water stress are pushing utilities to adopt smarter monitoring tools to extend system life and improve supply reliability.
The cost of monitoring has dropped significantly thanks to IoT and cloud computing. Tools like satellite moisture detection, AI-driven leak analysis, and predictive maintenance models are now commercially viable. Many solutions integrate with existing utility systems, making adoption easier and more scalable.
Despite the tech advances, many utilities operate on tight budgets and outdated systems. Only about 30% have fully implemented modern asset management tools[xxi]. The sector’s fragmentation—thousands of small utilities—makes scaling difficult. Integration with legacy infrastructure can be costly, and historically low water tariffs have limited the financial incentive for efficiency upgrades — yet rising water stress, regulatory pressure, and falling sensor and software costs are creating strong tailwinds for adoption and long-term investment growth.
Methane Leak Detection and Management
Methane leak detection and management involves detecting, preventing, and capturing methane emissions from sources like oil and gas operations, landfills, and agriculture. Since methane is over 80 times more potent than CO₂ in warming the atmosphere[xxii]—and is also the main component of natural gas—reducing leaks is both a climate and economic priority. Technologies include infrared and laser sensors, drones, satellites, and emissions analytics.
Capturing methane also can make financial sense—lost gas is lost revenue. With high natural gas prices and safety concerns, companies are investing in leak detection and repair (LDAR) to reduce risk and recover product. In addition, global governmental concern is high: over 150 countries have joined the Global Methane Pledge to cut emissions 30% by 2030[xxiii]. Regulations are tightening across sectors, especially oil and gas, landfills, and agriculture.
Technological innovation has surged. New tools—like drone-mounted sensors, satellite imaging, and AI-powered leak detection—are more accurate and affordable. Subscription-based services and integration with existing systems have made adoption easier. A growing number of startups and established firms are offering scalable solutions, helping to accelerate market uptake.
Despite available technologies, many emitters still don’t monitor leaks comprehensively. Inconsistent regulations and weak enforcement slow adoption. Fixing leaks—especially small, dispersed ones—can be logistically difficult. Without strong policy or pricing signals, some companies may delay action. These gaps create concerns for investors to consider — yet growing regulatory momentum, falling detection costs, and rising demand for verified emissions reductions are steadily improving the business case for methane mitigation solutions.
Smart Irrigation
Smart irrigation is about delivering the right amount of water at the right time to minimize waste. It combines modern hardware—like drip systems and micro-sprinklers—with IoT sensors and automation to monitor soil moisture, weather, and crop needs. This approach helps farmers save water, reduce costs, and improve yields.
Agriculture uses about 70% of global freshwater[xxiv], and many farming regions face water stress from droughts and groundwater depletion. Rising water prices and regulatory limits on water use are pushing farmers to adopt efficient systems. Smart irrigation also reduces labor, energy, and fertilizer costs, making it attractive for both compliance and profitability.
Technology costs have dropped, making tools like wireless soil sensors, cloud-based analytics, and satellite-integrated scheduling more accessible. Government grants and cost-share programs support adoption, and venture capital is fueling innovation. North America, especially the drought-prone West, is leading in smart irrigation uptake.
However, high upfront costs and ongoing software fees can be barriers, especially for small farms. Many growers lack the time, training, or internet access to fully utilize data-driven systems. Rural broadband gaps and the complexity of integrating new tech with existing practices slow adoption, keeping uptake below expectations in some regions — yet falling hardware prices, expanding government incentives, and growing awareness of water risk are steadily improving the outlook for smart irrigation adoption and investment.
Biochar
Biochar is a stable form of carbon produced by heating organic waste (like crop residue or manure) in a low-oxygen environment through pyrolysis. When added to soil, it improves fertility, retains moisture, and stores carbon for decades. The process also yields renewable energy byproducts like syngas or bio-oil, making it a dual-benefit solution for agriculture and climate mitigation.
Farmers are increasingly exploring biochar for its ability to enhance soil health, especially in degraded or drought-prone areas. It reduces fertilizer needs, improves water retention, and boosts yields. As sustainable agriculture gains momentum, biochar is gaining traction as a regenerative tool. Demand is also rising due to its role in carbon sequestration, which supports climate goals.
There’s abundant low-cost feedstock from agricultural and forestry waste. Biochar can be produced in setups ranging from simple kilns to advanced pyrolysis reactors, some of which also generate energy. As technology improves, production is becoming more efficient and scalable, and the cost per ton is falling—encouraging more market entrants.
However, adoption is still early-stage, with many farmers unfamiliar or hesitant to pay for biochar. Producers often rely on carbon credit sales, but this market is still relatively untested. Feedstock competition (e.g., from biofuel producers), infrastructure costs, and logistical hurdles like transporting bulky biochar add complexity. These factors create some uncertainty around scale and profitability for investors to consider — yet growing interest in regenerative agriculture, maturing carbon markets, and falling production costs are steadily improving the commercial outlook for biochar ventures.
Conclusion
Resource efficiency is not just a sustainability imperative, it’s a financial one. As input costs rise and regulations tighten, companies are turning to smarter, more efficient technologies to reduce costs and stay competitive. For investors, this presents a timely opportunity to back scalable solutions that reduce waste, cut emissions, and improve system performance across industries. The sectors highlighted here offer a compelling mix of impact and return potential in a resource-constrained world.
[i] World Economic Forum, Our resources are running out. These charts show how urgently action is needed, accessed July 31, 2025. https://www.weforum.org/stories/2024/03/sustainable-resource-consumption-urgent-un/
[ii] $1.9tn of this figure represents the estimated size of the efficiency and electrification market by 2030: International Energy Agency, World Energy Investment 2024, Overview and key findings, accessed August 12, 2025. https://www.iea.org/reports/world-energy-investment-2024/overview-and-key-findings. $1.5tn of this figure represents the size of the circular economy: Ellen MacArthur Foundation, An innovation pathway to decarbonization: circular economy solutions for policymakers and industry in the US, accessed August 12, 2025. https://content.ellenmacarthurfoundation.org.
[iii] Federal Reserve Bank of St. Louis, Global price of Energy index, accessed August 5, 2025. https://fred.stlouisfed.org/series/PNRGINDEXM
[iv] Utility Dive, US electricity prices outpace annual inflation, accessed July 30, 2025. https://www.utilitydive.com/news/us-electricity-prices-rise-customer-eia-outlook/710113/
[v] Utility Dive, US electricity prices outpace annual inflation, accessed July 30, 2025. https://www.utilitydive.com/news/us-electricity-prices-rise-customer-eia-outlook/710113/
[vi] Utility Dive, US electricity prices outpace annual inflation, accessed July 30, 2025. https://www.utilitydive.com/news/us-electricity-prices-rise-customer-eia-outlook/710113/
[vii] Water Magazine, Global Water Intelligence (GWI)’s recently released Global Water Tariff Survey 2024 report provides telling insight into the global landscape of water, accessed July 30, 2025. tariffs.https://www.watermagazine.co.uk/2024/10/02/tariff-increases-accelerate-to-record-breaking-levels-as-utilities-invest-in-resilience-according-to-newly-released-global-water-tariff-survey-report/
[viii] Corporate Governance Institute, Resource efficiency and corporate governance, accessed July 31, 2025. https://www.thecorporategovernanceinstitute.com/insights/guides/resource-efficiency-and-corporate-governance/
[ix] Science Based Targets Initiative, accessed July 8, 2025. https://sciencebasedtargets.org/target-dashboard
[x] Represents the estimated size of the global recycling market by 2030: Gitnux, Recycling Industry Statistics, accessed July 30, 2025. https://gitnux.org/recycling-industry-statistics/.
[xi] Represents the estimated growth of the metal recycling market. Global Newswire, Metal Recycling Market Size is projected to reach USD 384 Billion by 2030, growing at a CAGR of 5.85%: Straits Research, accessed July 30, 2025. https://finance.yahoo.com/news/metal-recycling-market-size-projected-170000651.html
[xii] Maximize Market Research, Waste to Energy Market: Global Industry Analysis and Forecast (2024-2030), accessed July 30, 2025. https://www.maximizemarketresearch.com/market-report/waste-to-energy-market-wte/13394/
[xiii] Grand View Research, Smart Water Management Market Summary, accessed July 30, 2025. https://www.grandviewresearch.com/industry-analysis/smart-water-management-swm-market
[xiv] Grand View Research, Leak Detection and Repair Market Summary, accessed July 30, 2025. https://www.grandviewresearch.com/industry-analysis/leak-detection-repair-ldar-market
[xv] PR Newswire, Smart Irrigation Market worth $2.65 billion by 2030 – Exclusive Report by MarketsandMarkets, accessed July 30, 2025. https://finance.yahoo.com/news/smart-irrigation-market-worth-2-140100304.html
[xvi] Cognitive Market Research, Biochar Market Report 2025 (Global Edition), accessed July 30, 2025. https://www.cognitivemarketresearch.com/biochar-market-report
[xvii] Gitnux, Recycling Industry Statistics, accessed July, 31, 2025. https://gitnux.org/recycling-industry-statistics/
[xviii] Statista, Recycling in the United States – Statistics & Facts, accessed July 31, 2025. https://www.statista.com/topics/1275/recycling-in-the-united-states/
[xix] UN Environment Programme, Global Waste Management Outlook 2024, accessed July 30, 2025. https://www.unep.org/resources/global-waste-management-outlook-2024
[xx] S&P Global, Lost Water: Challenges And Opportunities, September 6, 2023, accessed July 30, 2025. https://www.spglobal.com/_assets/documents/ratings/research/101585883.pdf
[xxi] Smart Water Magazine, ASCE’s 2025 Infrastructure Report Card shows overall progress, but water systems still lag behind, accessed July 31, 2025. https://smartwatermagazine.com/news/smart-water-magazine/asces-2025-infrastructure-report-card-shows-overall-progress-water-systems
[xxii] NASA, Accelerated growth in methane emissions due to human activities and climate change feedbacks, accessed July 31, 2025. https://science.gsfc.nasa.gov/600/public-nuggets/Earth-nugget022425.pdf
[xxiii] Global Methane Initiative (GMI). https://www.globalmethane.org/pmf/
[xxiv] World Bank, Chart: Globally, 70% of Freshwater is Used for Agriculture, accessed July 31, 2025. https://blogs.worldbank.org/en/opendata/chart-globally-70-freshwater-used-agriculture